Data from the first quarter of 2023 is beginning to show cracks in the U.S. economy’s performance. While headline inflation has receded, households are still beset with higher prices. The Fed has continued to firm monetary policy, but market interest rates declined in response to the failures of Silicon Valley Bank and Signature Bank, and concerns over broader contagion in the banking sector and the U.S. economy overall. The housing market is now in recession in all but a select few markets. And employment, which was perhaps the brightest bulb in the economic strand, is beginning to dim with the March data.
Employment
Let’s look first at employment. The March jobs report was in line with expectations, but reflected a slowing of labor market trends. Non-farm payrolls grew by 236k, the smallest amount since December 2019 (excluding the months when jobs were eliminated due to the economic shutdown in response to the pandemic). For the first quarter, payroll growth averaged 345k per month, vs. 561k per month in Q1 2022. Furthermore, the Q1 2023 trend clearly shows a slowdown: payrolls grew by 472k, 326k, and 236k, respectively, in January, February, and March.
The unemployment rate fell unexpectedly in March, from 3.6% to 3.5%, due in part to an increase in labor force participation to the highest rate since before the pandemic. This is good news for employers that have faced difficulty in attracting talent, though most of the job gains in March were in leisure and hospitality and government jobs. The financial sector shed 12,000 jobs; payrolls in the sector have declined for five consecutive months, falling by 41,000 during that stretch.
Perhaps the biggest sign of weakness in the labor picture came not from the March jobs report, but from the job openings report for February, which showed 9.9 million job postings. That’s still well above the pre-pandemic trend level of about 7.2 million, but it was an unexpectedly sharp drop from the January level, which was revised downward by about 260k, and is the lowest level of job openings since May 2021.
The key driver behind the staffing challenges faced by credit unions – and other organizations – over the past two years has been the disequilibrium between job openings and job recovery from the shutdown of the economy in response to the pandemic. While it’s true that job quits reached record levels, those workers sought and found employment elsewhere; after all, both the unemployment and, more importantly, underemployment rates have fallen, and labor force participation has increased.
Job quits are also down by nearly 500k since last April, a further sign of emerging labor market weakness, as worker confidence is waning. However, quits remain about 500k above pre-pandemic levels. While an elevated level of job quits may pose retention challenges, it should theoretically alleviate hiring challenges as long as unemployment is falling, and labor force participation is increasing. This has not been the case.
The problem is that, in less than two months in 2020, we eliminated more than 22 million jobs by taking the unprecedented step of shutting down the U.S. economy. Beginning in May 2020, it took more than two years – until June 2022 – to recover all of those jobs. However, the economy was growing in early 2020, before the shutdown, at a pace of about 200k jobs per month, and there was nothing on the horizon to indicate that pace of growth wouldn’t continue. Had that been allowed to occur, total non-farm payrolls today would be approximately 4.2 million higher than they actually are (see Figure 1 below).
Figure 1
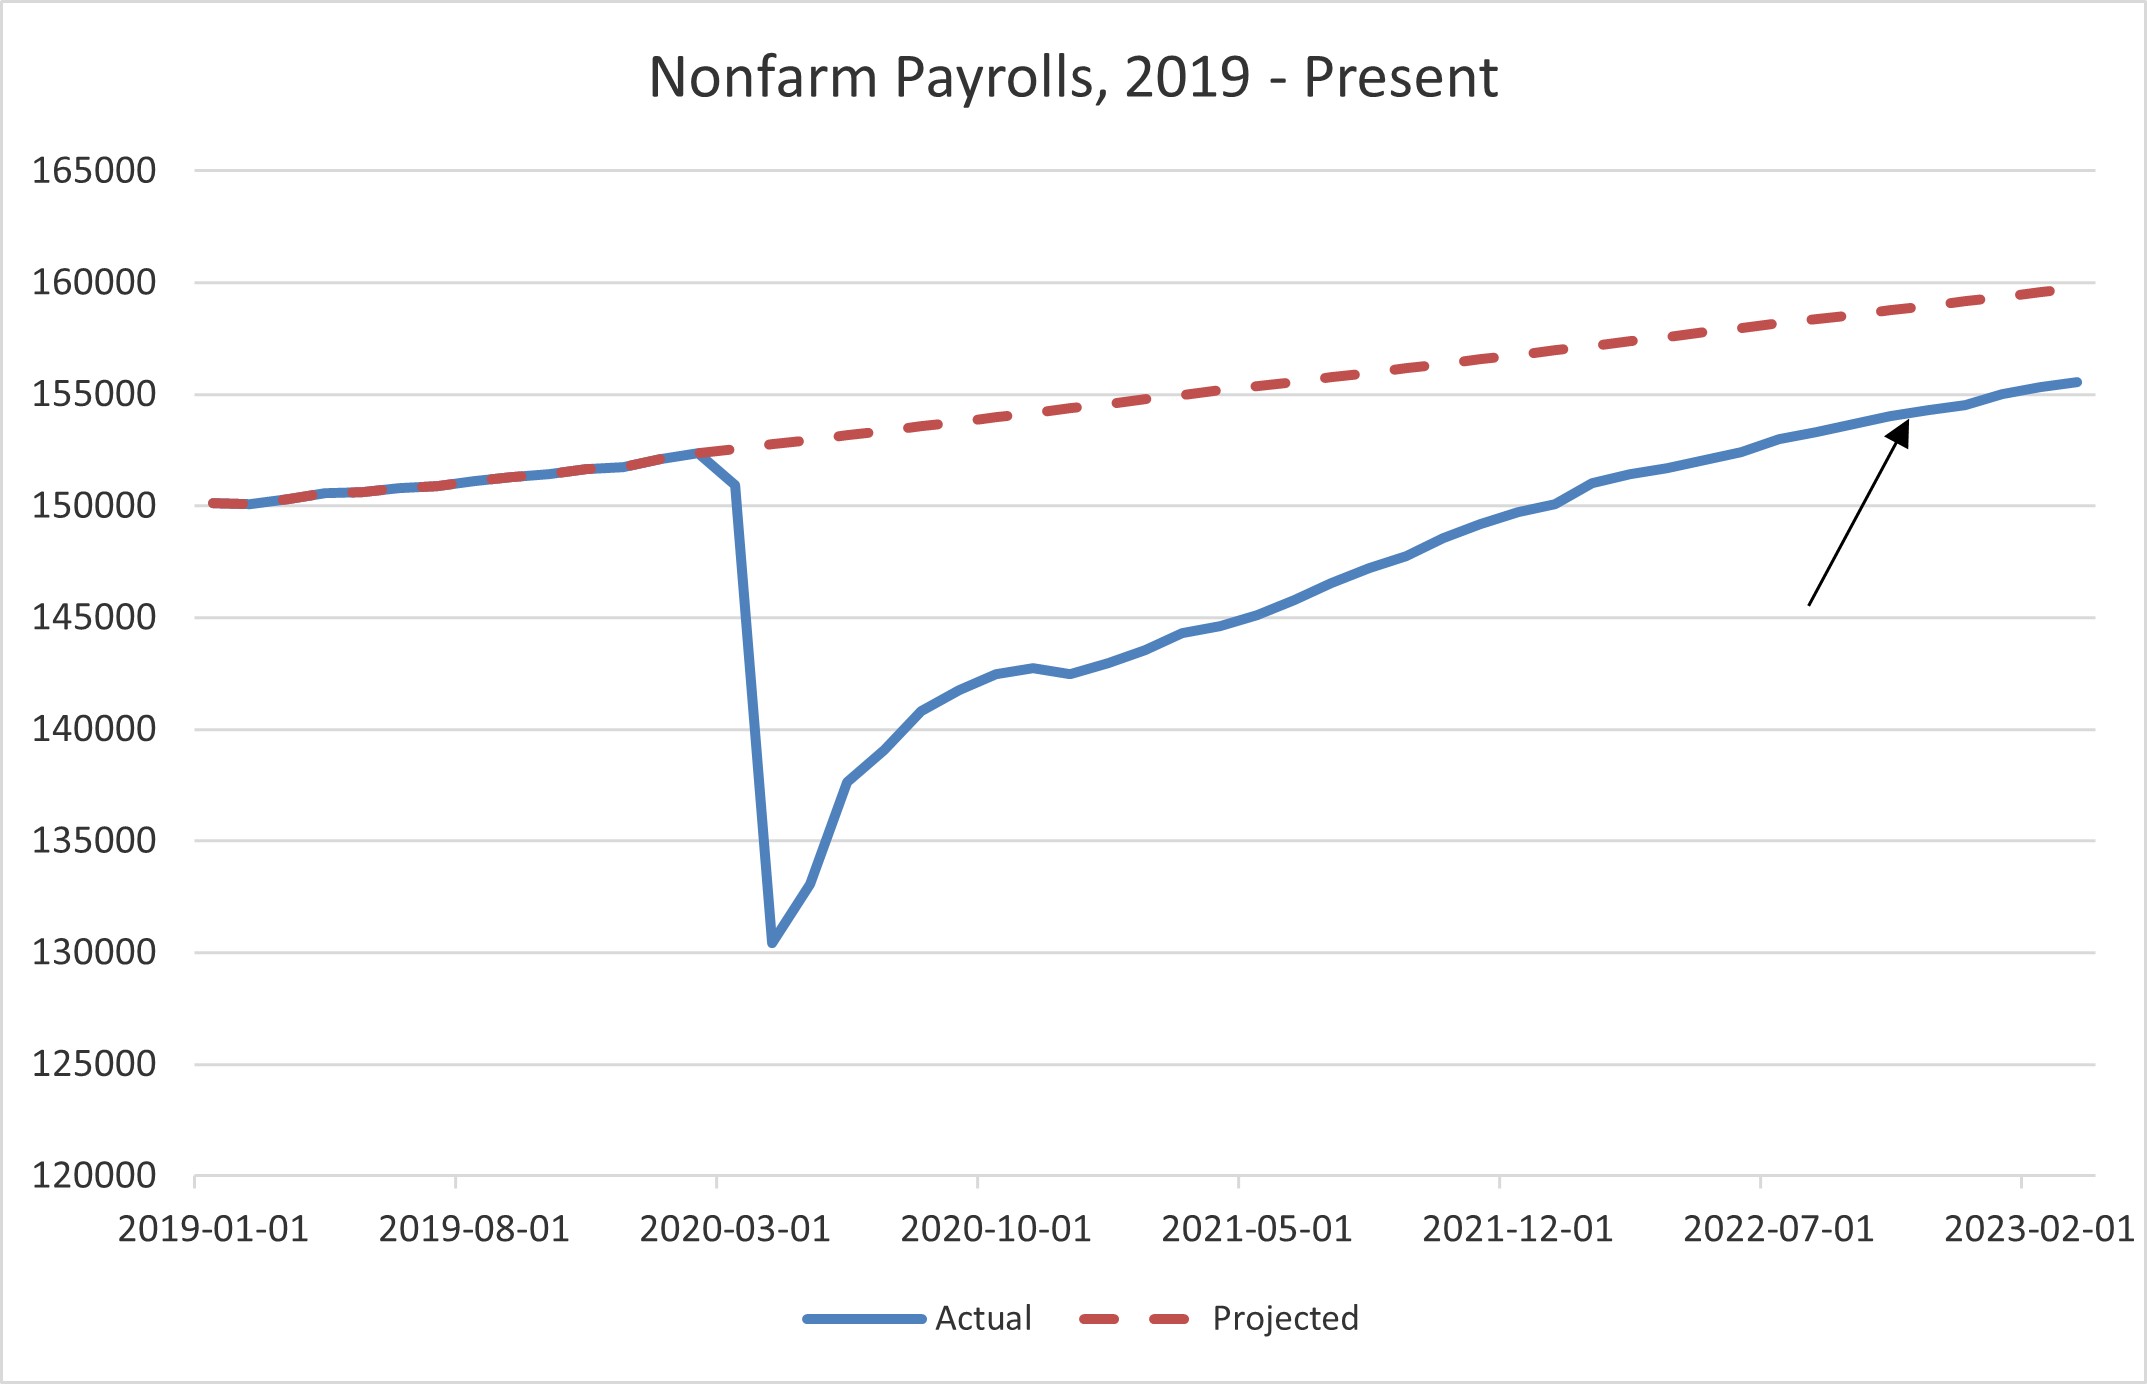
In other words, we’re still catching up to where we should be, given economic growth – i.e., we haven’t fully recovered all the jobs that would have been created through growth, had we not shut down the economy. Since May 2022, we haven’t been creating new jobs, we’ve been recovering jobs that were eliminated, and that would have been added through natural growth.
The flip side of this can be seen in the job openings numbers, which, not coincidentally, have been trending about 4 million above the trend level from 2019, prior to the pandemic. At that time, job openings averaged about 7.2 million per month. From June 2021 through January 2023, they averaged over 11 million per month, peaking above 12 million in March 2022. The excess job openings represent the “growth gap” caused by the shutdown: the number of jobs that would have been created by now, through natural economic growth, since February 2020.
So as payrolls have grown at a pace above that 200k monthly trend level, the U.S. labor force has been catching up, albeit slowly. (Nonfarm payroll growth averaged more than 500k per month in 2021 and 2022.) As previously mentioned, we finally recovered all the jobs eliminated in June 2022; now we’re working on the jobs that would have been created through growth. Thus to reach equilibrium, that above-trend pace of growth must continue until the two lines in Figure 1 converge. Or …
An economic slowdown could force equilibrium sooner, by bringing about a “natural” (rather than forced, as was the case with the shutdown) end to job growth. This would coincide with a decline in job openings. Since we’re already seeing a rather sharp decline in that measure (job postings are down 1.3 million over the last two months), it would appear that the supply and demand for labor may be brought into balance sooner, rather than later, although the process may be somewhat painful.
Housing
Housing is another area of weakness. The January S&P/Case-Shiller home price data showed that four of the 20 markets in the Composite Index are now in negative territory on a year-over-year basis (vs. two markets in December): San Francisco, Seattle, Portland, and San Diego. Miami remains the strongest market, with a year-over-year price gain of 13.8%; only Miami and Tampa still have year-over-year price growth in double digits. The Composite Index as a whole is up just 2.5% year-over-year, the lowest rate since October 2019. Half the markets in the Composite Index have year-over-year growth rates less than that average.
On a monthly basis, before seasonal adjustments, all but Miami posted declines among the 20 markets in the Composite Index. On a seasonally-adjusted basis, five markets – Miami, Boston, Charlotte, Cleveland, and Chicago – posted monthly gains. However, the year-over-year pace of growth declined for every market in the Composite Index.
More broadly, many markets outside the S&P/Case-Shiller dataset are also exhibiting weakness, including previously “hot” markets like Boise, Austin, and Nashville, as well as others.
Despite widespread home price weakness, we continue to believe that this housing correction is unlikely to produce the credit losses seen in 2008-09. In addition, declining prices, combined with recent easing of mortgage rates (and expectations of further declines in rates in response to anticipated economic weakness) may arrest the decline in home prices. The recent price declines are nothing more than a reversion to the mean of the rate of home price appreciation, following an unsustainable bubble that persisted for 20 months, fueled by record-low mortgage rates brought on by zero interest rate policy enacted by the Fed in response to the pandemic.
Inflation and Interest Rates
The headline inflation rate reached 6.0% year-over-year in February, the lowest rate since September 2021. However, inflation hasn’t been at 6% or above since 1990, so prices remain high. Food prices are still up nearly 10% vs. a year ago, and gas prices are surging in response to a planned cut in oil production by OPEC that will begin in May, just ahead of the summer travel season. And we have yet to see whether the December 2022 spending bill will produce a spike in the inflation data, just as the spending bill passed in early 2021 ignited the most recent inflationary cycle.
Still, the combination of tamer inflation data and weakening economic data suggests that the Fed may be nearing the end of its unprecedentedly aggressive tightening cycle. Following the March jobs report, Fed funds futures priced in a 67% probability of another 25 basis point (bp) rate hike at the May FOMC meeting, with no further action priced in for the June meeting. And in anticipation of emerging economic weakness, the futures market has priced in a 48% probability of a 25bp cut at the July meeting, signaling an immediate reversal of monetary policy (which is not unprecedented, observing previous tightening cycles).
The Treasury market seems to be sending similar signals. Bonds had been trading on the inflation story for more than a year, but were disrupted by the recent bank failures and associated fears regarding that sector, resulting in an immediate drop in yields. Yields have remained about 70-100bp lower than before the banking sector turmoil, and that probably has more to do with recession expectations than lingering concerns over the financial industry’s health. The curve remains inverted, though less so than in early March, but still by more than 50bp, yet another indication of an expected downturn.
Conclusions
The labor market is showing early signs of weakness, and housing is already in recession. (President George H.W. Bush famously said, “As housing goes, so goes the economy.”) The Fed appears to be nearing the end of its tightening cycle as inflation pressures have abated (for now), although prices remain high, and both Fed funds futures and the yield curve have priced in a recession in 2023.
Obviously, credit unions should take the usual precautions ahead of an economic downturn: adjust underwriting criteria as appropriate; monitor credit metrics and loan portfolio performance; be proactive in working with members who may face difficulty in meeting loan obligations (especially those with adjustable-rate loans whose payments may increase in the near future); and adjust reserves as necessary, which is already taking place with the implementation of CECL. Credit unions should also be mindful of expenses.
However, we see the emergence of a downturn as an opportunity. As some organizations go into retrenchment mode, their successful peers will take the longer view, and seize the opportunity to position themselves to take advantage of the recovery that will follow. We do not foresee a prolonged or deep credit recession, such as those that occurred in 1990-91 and 2008-09.
As labor market conditions normalize, there will be opportunities to attract talent from financial firms that are slashing positions, particularly in mortgage lending. And credit unions with a surplus of risk-adjusted capital may be well-positioned to make strategic investments in digital channel enhancements, leveraging data, and other initiatives vital to growth and competitive advantage.
For more information about how Rochdale can assist in measuring risk-adjusted capital and using risk management to ensure your credit union is positioned to take advantage of the opportunities that the emerging economic environment presents, as well as to navigate the choppy waters ahead, contact sales@reimaginerisk.com.