Consumer inflation is at the highest level in 40 years: the Consumer Price Index (CPI) year-over-year is up 7.5% as of January 2022, the highest rate since February 1982. To put that in perspective, the last time consumer inflation was this high I was an undergraduate in college, and today I qualify for senior citizen discounts at some establishments. And inflation by any other measure is at similar long-term highs. In fact, the Producer Price Index (PPI) for finished goods, a leading indicator of future consumer prices, ended December up 12.4% year-over-year, the highest rate since 1980.
Average hourly earnings are also accelerating. The year-over-year gain was 5.7% as of January. This is somewhat good news in that stronger earnings growth helps ease the sting of higher prices. However, given that the pace of inflation is higher than that of wage gains, real earnings growth – earnings growth adjusted for inflation – is -1.8% as of January. In October 2021 it was -.08%, so real wage growth is clearly deteriorating. Also, because unit labor costs are the largest unit cost input to the cost of goods and services, accelerating wage growth is another leading indicator of higher consumer prices. In turn, the inflation picture is likely to worsen.
The markets understand this. And because they do, there’s a good chance that the market will perceive that the Fed is not being aggressive enough in the fight against inflation as it pursues its monetary policy objectives in 2022. If that happens, we can expect rates to climb higher than previously believed. We need only look at what happened in 1994 to find an historical example.
A Trip Down Memory Lane
In September 1993, the Federal Open Market Committee (FOMC) unexpectedly cut the Fed funds target rate to the then-unheard of low of 3%. (Prior to 2008, the FOMC set a single target rate for Fed funds. After that time, they began to set a 25 basis point, or bp, range for the target.) GDP growth had slowed throughout 1993, and inflation was benign, with CPI below 3% by September 1993.
It should be noted that the cut to 3% was considered extreme, even though by today’s standards that rate appears high. Historically, at the time, it was less than a third of what the target rate had been just four years earlier. And the September cut was the 24th consecutive rate cut by the FOMC in just over four years. So, the market was somewhat nervous about rates being that low – just as the market is nervous about rates being at virtually zero today, with GDP growth above 5% and CPI at four-decade highs.
The economy began to pick up quickly after the steep cut. Between 1993 Q3 and 1994 Q2, GDP growth accelerated from 2.3% to 4.2%. Early in the year, market participants began calling for aggressive tightening by the Fed. Historically, when the Fed raises the target rate, it does so 25 bp at a time. (When it eases, it often does so more aggressively.) Beginning in February, the FOMC raised the target rate by 25bp and this same increase of 25bp followed suit for March and April bringing the target rate to 3.75%.
The market perceived each of these moves as being not sufficiently aggressive, calling for 50 bp hikes. Each time the Fed tightened by 25 bp, the market responded by selling off after the FOMC meeting, bidding up rates to what the market perceived they should have been, had the Fed been as aggressive as they needed to be to curb economic growth. In short, the market believed that the Fed was getting behind the economy and was going to potentially lose the battle against inflation. The market believed the Fed would ultimately have to tighten more, and for a longer period of time, to achieve its goals. Mind you, CPI never got above 3% in 1994 – juxtapose that against today’s scenario.
The market continued to punish the Fed. The two-year yield started January at benign levels. The January 12, 1994, two-year yield was 4.05%, just 105 bp above the Fed funds target. By May 9, the market perceived that the Fed, having moved just 25 bp at a time, was getting behind the economy, and the two-year yield was bid up to 6.26%, an increase of 221 bp since January 12 and 251 bp above the Fed funds target.
The ten-year yield showed a similar pattern, increasing from 5.6% on January 12 – 260 bp above the Fed funds target – to 7.49% by May 9, an increase of 189 bp and 374 bp above the funds target. (Note that the ten-year yield is less sensitive to movements in the Fed funds target than the two-year yield.)
Finally, the FOMC got the message. It raised the funds target by 50 bp at its May meeting, to 4.25%, and by another 50 bp at its August meeting, to 4.75%. Then, it tightened by a nearly unprecedented 75 bp at its November meeting, to 5.50%. Still, the market wasn’t finished with the Fed. On December 23, the two-year yield peaked at 7.74%, up 369 bp from its January 12 level. Yet the Fed had tightened by just 250 bp.
In February 1995, the FOMC completed its tightening round with a final 50 bp hike, to 6%. By then, the market was satisfied. The two-year yield was back down to 7.14%, a 60 bp drop from December, and the ten-year was at 7.49%, down from 8.05% in November. Sure enough, GDP growth began to cool off in 1995, and CPI remained below 3% for most of the year.
Back to the Present
So how does that trip down memory lane play into 2022? The FOMC has signaled that it will increase rates three times this year, by 25 bp each time, for a total of 75 bp of rate increases. That would move the Fed funds target from the current range of 0-25 bp to 75-100 bp. This course of action has been specifically outlined by Fed Chairman Jerome Powell on several occasions.
It is also illustrated by the “dot plot” from the December 15, 2021 FOMC meeting. The dot plot represents the consensus of FOMC members regarding their outlook for future levels of the Fed funds target. Each dot represents one member’s outlook for the future target level. The December 15 dot plot is shown in Figure 1 below.
Fig. 1. FOMC Dot Plot, December 15, 2021
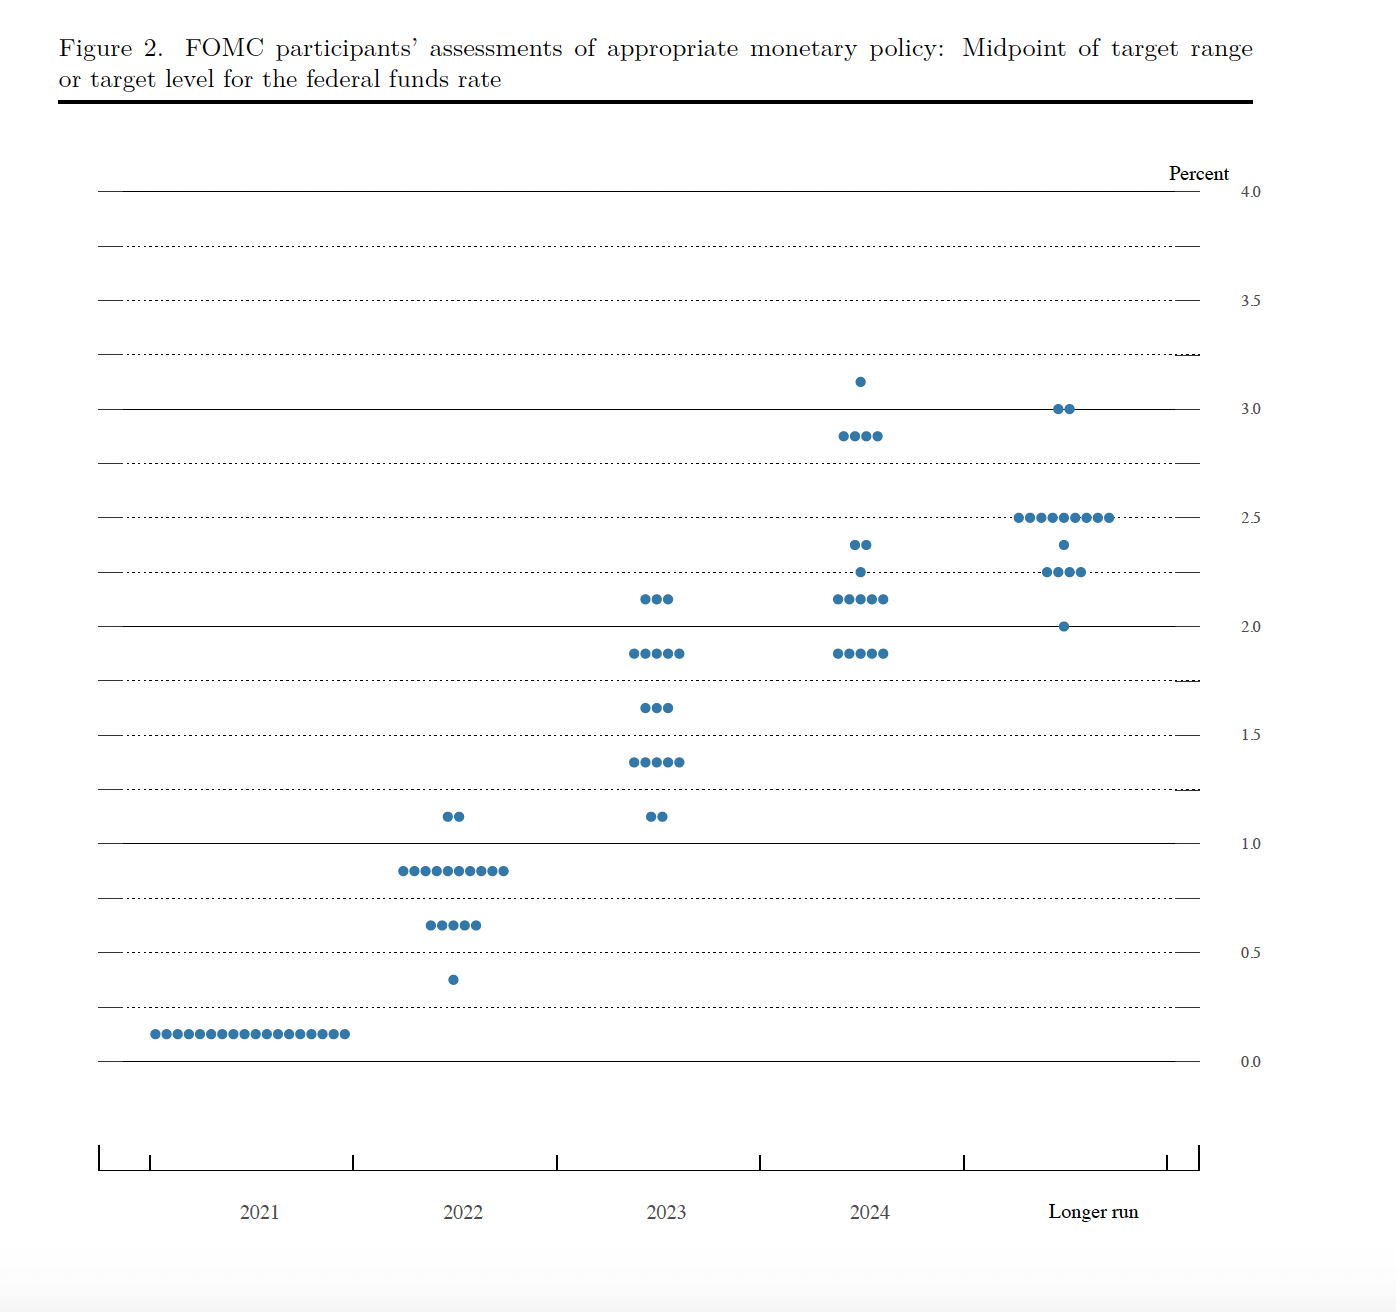
The dot plot shows that the consensus of members expects that, for all of 2022, the target range will be between 75 and 100 basis points. One member sees it being 25-50 bp, five see it at 50-75 bp, and two see it at 100-125 bp. But the consensus is consistent with Chairman Powell’s stated course of action: three 25 bp hikes in 2022.
All well and good – but what does the market think? Since the December 15 FOMC meeting, the two-year yield has risen from 69 bp to 1.61%, an increase of 92 bp – more than the Fed has indicated they’ll tighten in all of 2022! The ten-year yield has risen from 1.47% on December 15 to 2.03%, an increase of 56 bp.
Even more telling, though, are the expectations of the Fed funds futures market. The Chicago Mercantile Exchange (CME), on which those contracts trade, has developed a tool showing the implied probabilities of various future levels of the Fed funds target rate based on the trading levels of Fed funds futures contracts. The tool aligns forward contract expiration dates with future FOMC meeting dates to calculate implied probabilities for each meeting date.
Figure 2 below shows the implied probabilities, as of this writing, for the December 14, 2022 FOMC meeting.
Fig. 2. CME FedWatch Tool, December 14, 2022 FOMC Meeting
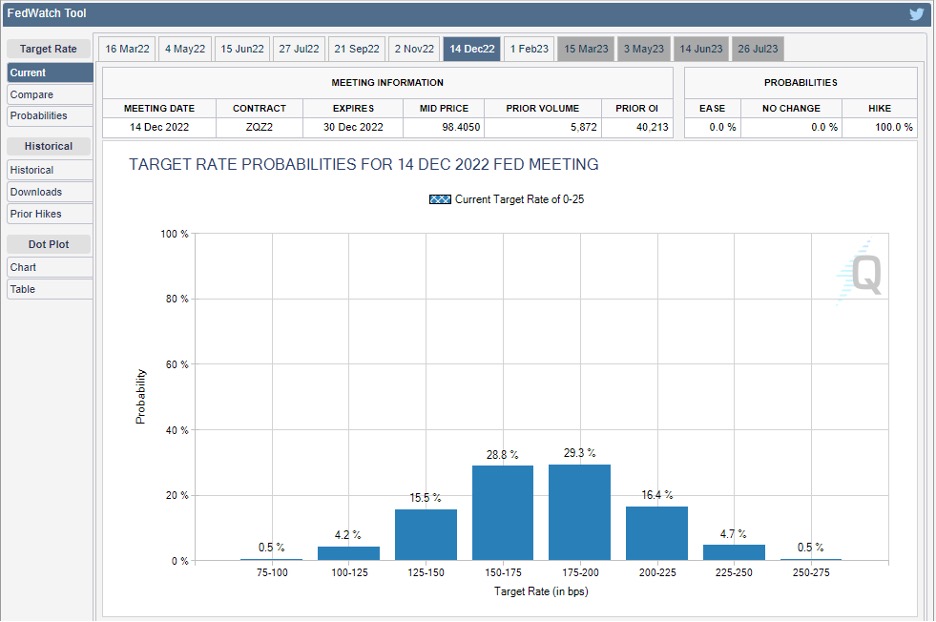
As Figure 2 illustrates, according to the Fed funds futures market, there is nearly an 80% probability that the Fed will raise the funds target at least six times in 2022, to 150-175 bp or higher – twice as much as signaled by Chairman Powell and the December 15 dot plot. And there is more than a 50% probability of seven or more hikes in 2022.
(Of course, this doesn’t preclude fewer, but larger hikes – several of those moves could be 50 or even 75 bp, as we saw in 1994, especially if the Fed gets behind the market early, and has to start playing catch-up.)
This is our best indication of what will happen to the yield curve if market participants perceive that the Fed is not being aggressive enough in the fight against inflation. It should not be lost on anyone that the run-up in the two-year yield, and the shift in Fed funds futures traders’ expectations, came after the December and January CPI releases, which showed year-over-year inflation up more than 7% for the first time since the 1980s. Thus it will be important to continue to monitor those numbers. If the inflation rate continues to climb, the market will expect the Fed to be even more aggressive.
An early test for the FOMC will come at its March 16 meeting. Currently, the implied probability is split 50-50 between a hike of 25 bp and one of 50 bp; either way, there is a zero probability of no action. So if the Fed doesn’t move on March 16, expect a sizeable sell-off in the two-year yield. If they tighten by 25 bp, a sell-off is still likely, especially if the February CPI numbers – due out about a week before the March meeting – show still-rising inflation.
So Now What?
If we do see the Fed get behind the market this year, with the yield curve steepening in similar fashion to 1994, what does that year tell us about what credit unions can expect?
First, a fairly rapid extension of duration. There was a significant whipsaw in the mortgage market from 1993 to 1994, with prepayments falling dramatically and durations extending, especially on CMO tranches with limited or no protection. Callable notes also extended. Mortgage refinancings will likely dry up, especially since many of today’s borrowers have no historical perspective and believe that a 5-6% mortgage rate is historically high, when in fact it’s well below the long-term average.
We’d also likely see a sharp slowing of home purchase activity, which would bring about a correction to the widespread housing market bubble that has developed over the past couple of years. In some markets, that correction will mean a period of declining prices, though it’s very unlikely to be as dire as in 2008-09. In many others, it will simply mean a period of no price appreciation, until the pace of price movements reverts to the mean.
Deposits would likely increase, and credit unions should lag repricing as much as possible to avoid an interest rate squeeze. “Low rate fatigue,” from savers having earned next to nothing on deposits for many years, may hinder this ability, especially given that real rates, adjusted for inflation, are significantly negative.
The biggest risk may be that rising auto loan rates bring about a rapid correction to the used car price bubble, which could put high-LTV loans at risk, especially since many of those same borrowers are the people experiencing negative real wage growth. Of course, supply factors will play a role in how and when that correction materializes as well.
The bottom line is that we hope Chairman Powell et al are students of history, as we are. They would do well to pay heed to the lessons of 1994, and not fall behind in their fight against inflation. If they do, the early indications from the Fed funds futures market suggest that the markets stand ready to do their job for them.